40+ Essential Obesity Statistics and Trends in the UK (2024)
Written by
futurefit
https://www.cdc.gov/healthy-weight-growth/food-activity/overweight-obesity-impacts-health.html?CDC_AAref_Val=https://www.cdc.gov/healthyweight/effects/index.htmlAn increasing number of individuals in the UK are choosing to combat obesity. There are many reasons why this is happening.
It might be the recent world pandemic and the fact that a sedentary life never helped anyone lose weight. Or maybe it’s well known that obesity carries lots of other serious illnesses.
If you’re wondering whether it’s time for you to tackle obesity, the following obesity statistics and trends might convince you it’s the right thing to do in 2024.
The prevalence of obesity in the UK has been steadily increasing over the past few decades.
Here are some statistics across different categories:
Adult obesity statistics
Obesity costs the UK over £6 billion every year, according to the NHS.
The WHO reports that at least 2.8 million people die every year because of obesity.
People living in deprived areas are more likely to be obese.
One in ten children is obese by 5 years old, with the number increasing to over 20% by age 11.
In 2021/2022, 4,035 people had bariatric surgery in England because of obesity.
The NHS reported that over 20% of adults were inactive, doing less than 30 minutes of physical activity weekly.
Overweight people are twice as likely to get high blood pressure.
About 90% of adults with type 2 diabetes in the UK are obese or overweight.
In 2021 – 2022, 10.1% of children between 4 and 5 years old were obese, while over 12% were overweight, according to the NHS.
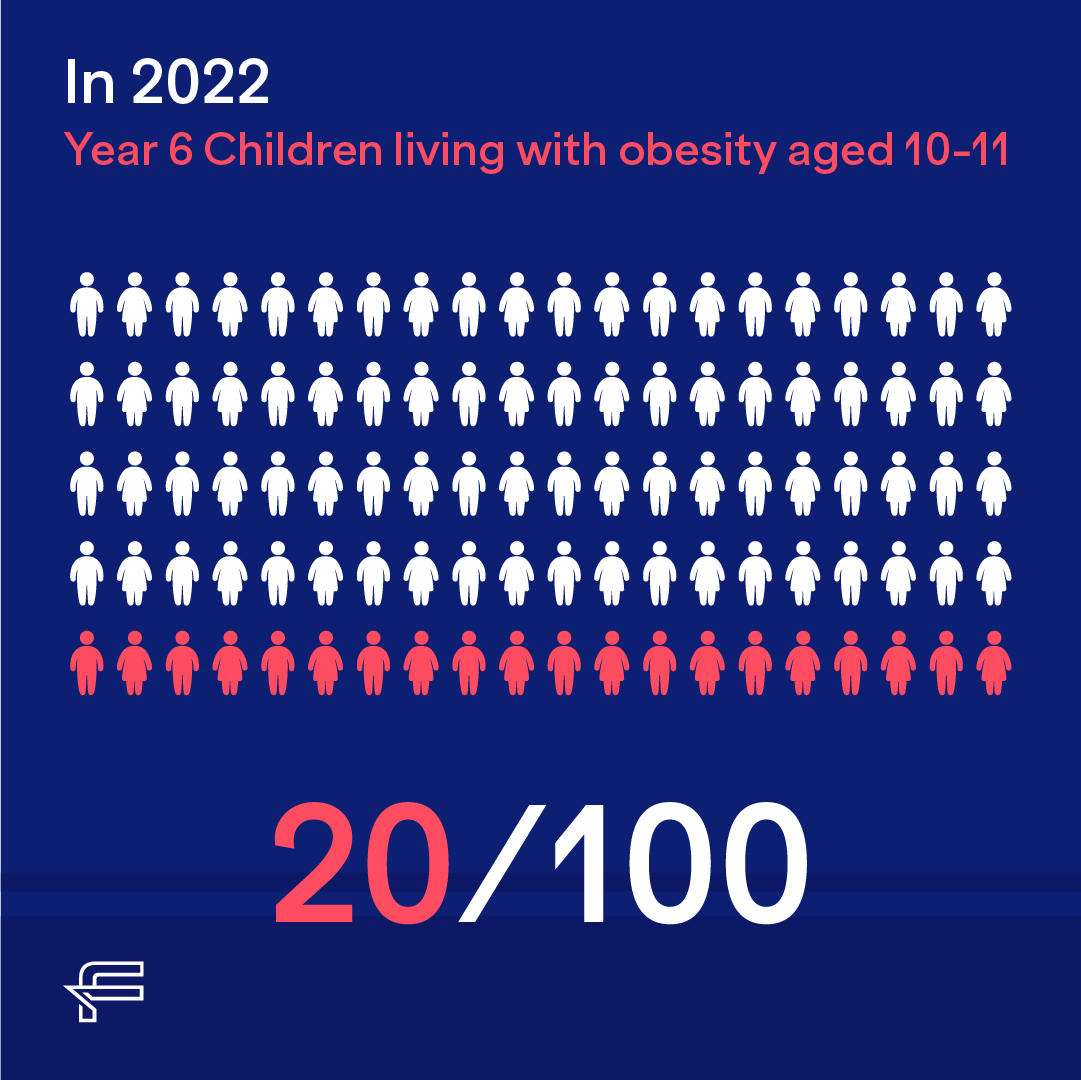
Over 20% of children between 10 and 11 years were obese, with 14-3 being overweight.
Boys are more likely to be obese than girls.
Children living in the most deprived areas of England were more likely to be obese (31.3%) compared to those living in the least deprived areas (13.5%).
In Scotland, 20% of children between 2 and 6 years were obese, 22% of children between 7 and 11 years, and 12% of children aged 12 to 15.
Obesity Demographic Statistics
The prevalence of obesity is over 10% higher in the most deprived areas in England (72%) than in the least deprived areas (58%).
People between 45 and 74 years old are more likely to be obese or overweight compared to adults between 16 and 24 years old (28%).
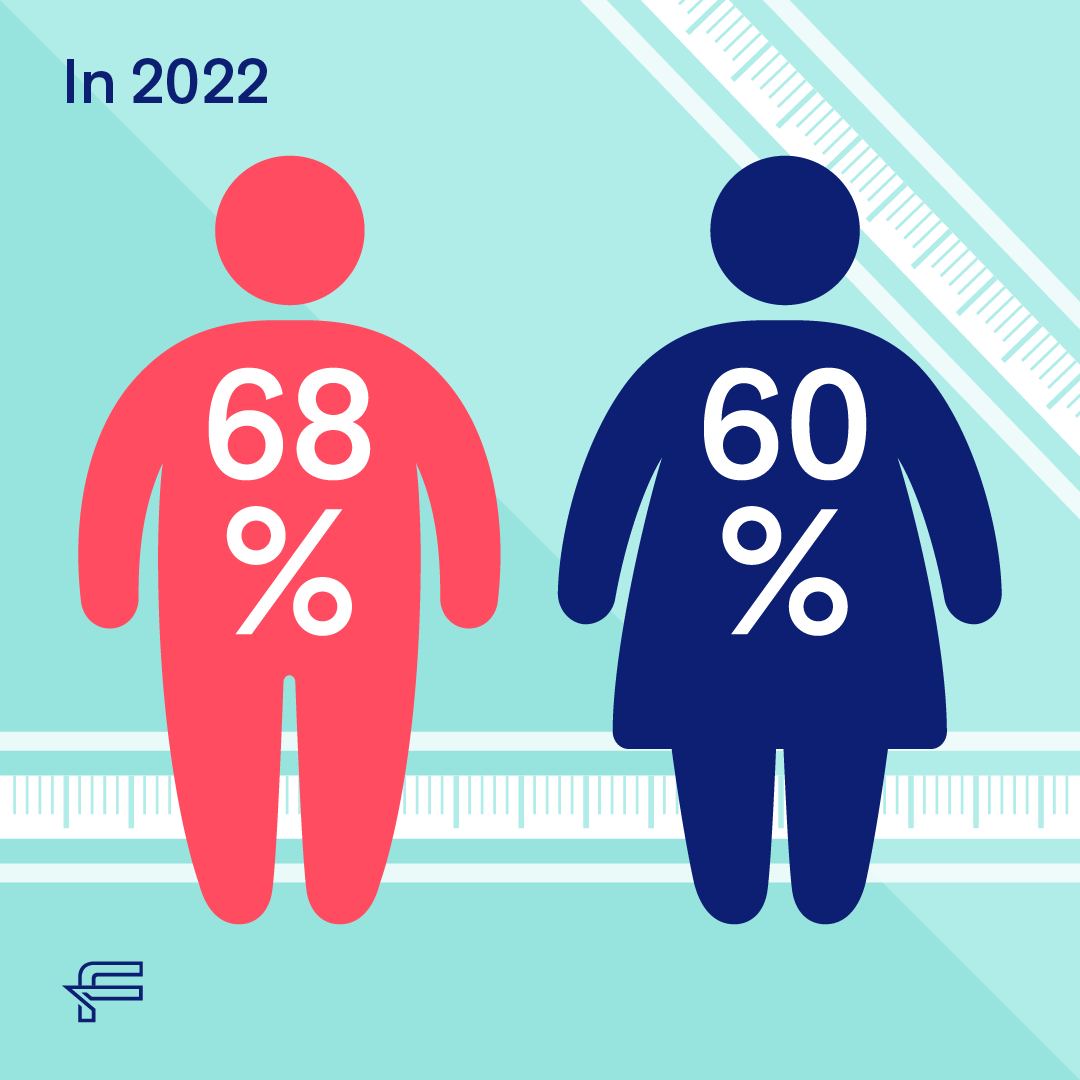
From 2021 to 2022, 63.8% of adults over 18 years in England were estimated to be obese or overweight – an increase from the previous year (63.3%).
Obesity is more dominant in people with disabilities (73%) compared to people without (61%).
People with black ethnicity are more susceptible to obesity (72%) compared to other ethnicities – White British (64%), Mixed (59%), White Other (58%), Asian (57%), and Chinese (37%).
Over 70% of people over the age of 55 in Scotland were obese or overweight.
Obesity in Wales was highest in people between 45 and 64 years (29%).
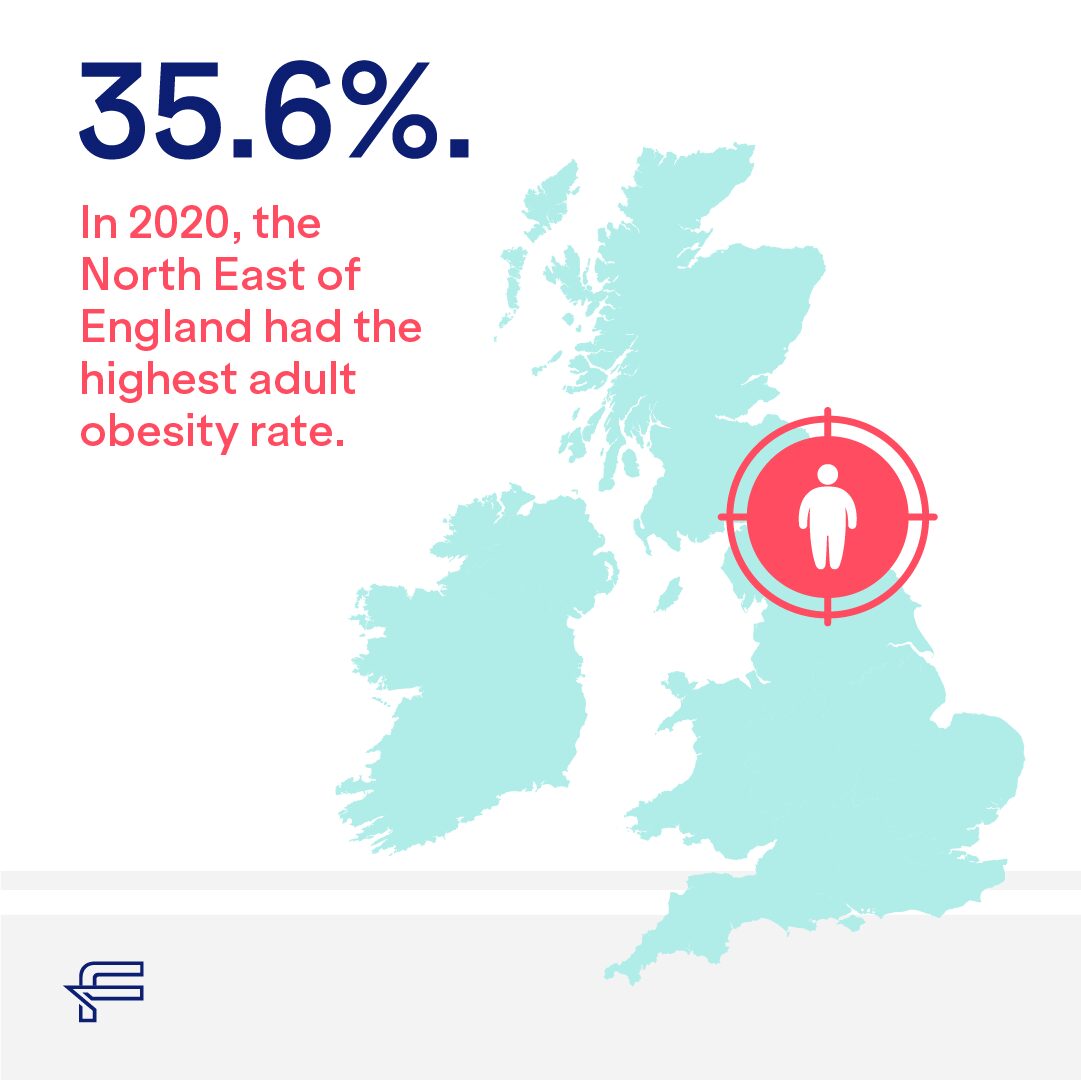
In 2020, the North East of England had the highest adult obesity rate at 35.6%.
London had the lowest adult obesity rate at 22.0%.
IBarking and Dagenham had the highest child obesity rate in England in Reception (aged 4-5) at 30.2%.
Kingston upon Thames had the lowest child obesity rate in England in Reception (aged 4-5) at 11.4%.
Obesity cost statistics
Frontier Economics found that the social annual cost of obesity in the UK is over £50 billion.
About a 10% reduction in obesity in the UK can result in a social gain of about £6 billion yearly.
Most prevention programmes would cost up to £100 million every year.
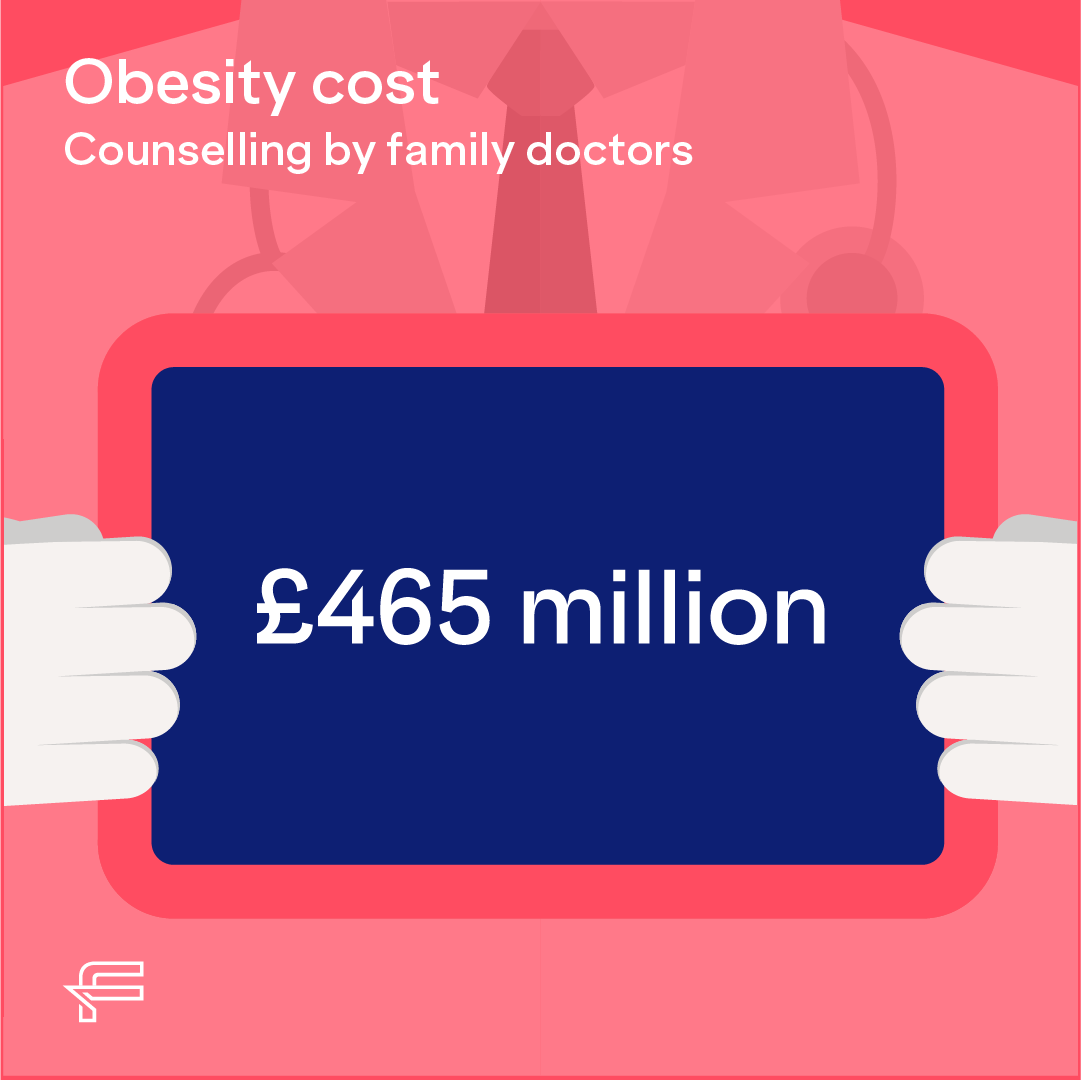
Individual counselling by family doctors costs up to £465 million.
Prevention can save up to £30,000 of life gained in good health.
School-based food can save up to £90,000 of life gained in good health.
UK Areas:
In 2020, the North East of England had the highest adult obesity rate at 35.6%.
London had the lowest adult obesity rate at 22.0%.
IBarking and Dagenham had the highest child obesity rate in England in Reception (aged 4-5) at 30.2%.
Kingston upon Thames had the lowest child obesity rate in England in Reception (aged 4-5) at 11.4%.
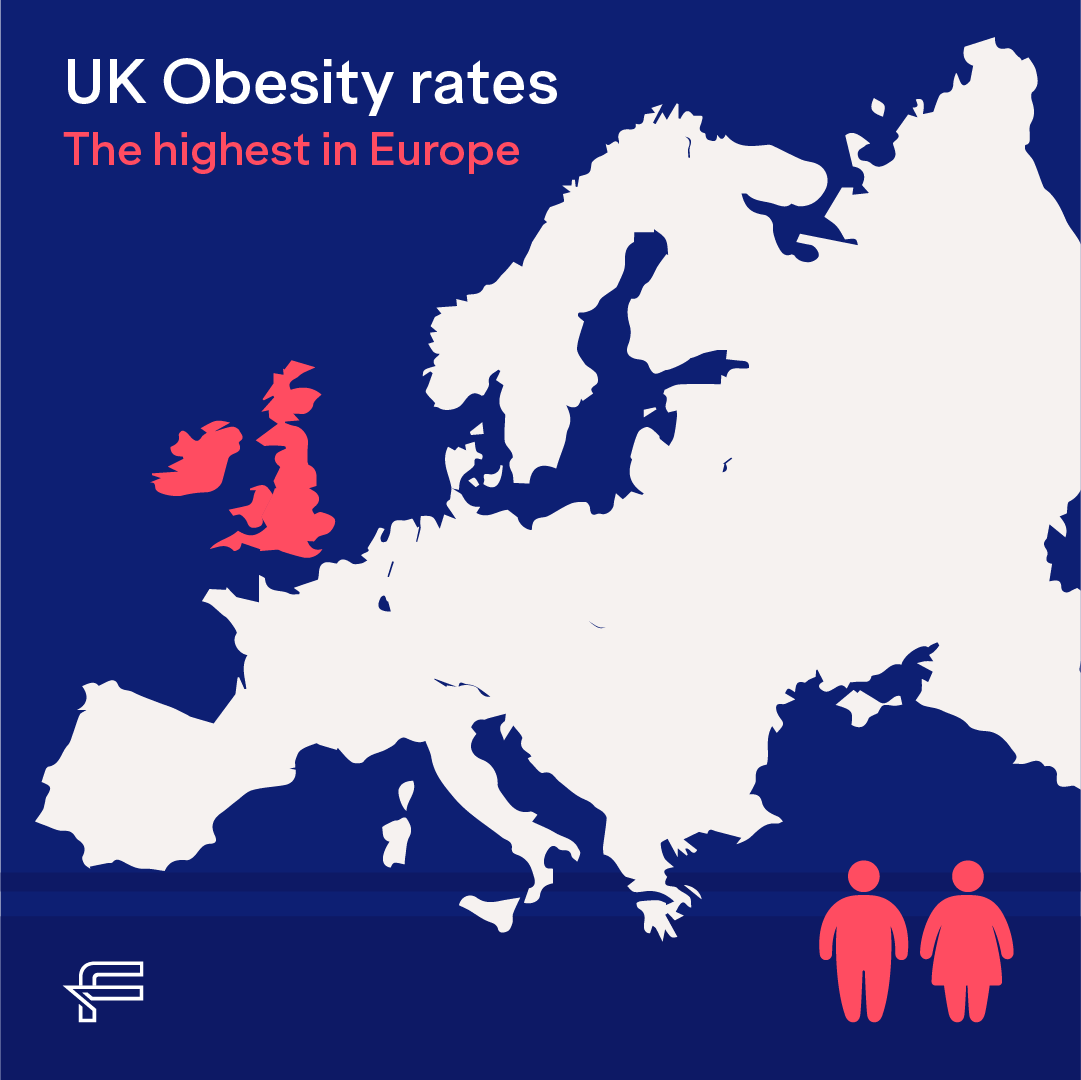
Comparison to Other Countries
The United States had over 40% of people with obesity, compared to the UK’s 28%.
In England, rates have increased faster than in most OECD countries.
In 2019, the UK had the third-highest adult obesity rate among OECD countries at 27.8%, behind only the United States and Mexico.
In 2019, the UK had the highest child obesity rate among OECD countries for girls aged 5-19.
In 2019, the UK had the second-highest child obesity rate among OECD countries for boys aged 5-19, behind only the United States.
Trends:
Foresight modelling reports that by 2050, 60% of adult men, 50% of adult women and over 20% of all children under 16 could be obese.
According to the OECD, the proportion of overweight individuals in England is expected to increase by 10% over the next decade.
In 1993, the adult obesity rate in England was 13.2%.
In 2022, the child obesity rate in Reception (aged 4-5) in England was 21.6%. It almost doubled since 1993.
In 2020, the adult obesity rate in Scotland was 29%, an increase from 27.8% in 2018.
NHS costs assigned to obesity are projected to reach £10 billion yearly by 2050.
Child obesity at Reception is expected to rise to about 25% by 2040, with obesity in Year 6 pupils rising to over 40%.
By 2040, over 70% of people will be classified as obese or overweight in the UK.
According to the OECD, the proportion of overweight individuals in England is expected to increase by 10% over the next decade.
Radiologists conducted 43.3 million imaging tests in England in the 12 months from April 2021 to March 2022.
In 1993, the adult obesity rate in England was 13.2%.
Sources:
Public Health England. (2022). Adult obesity and type 2 diabetes.
Scottish Government. (2022). Scottish Health Survey 2021.
Welsh Government. (2022). National Survey for Wales 2020-21: Adult health and lifestyle.
Department of Health, Northern Ireland. (2020). Health Survey Northern Ireland 2019/20.
National Child Measurement Programme. (2020). 2020/21 school year.